GWGreywake Use-Case Guides
Flagship use case · Operations & Resilience

Capacity Forecaster

Forecast productive capacity by role using utilization, time-off, efficiency, demand, backlog, confidence ranges, and staffing gaps.

App v2.0.0Site v6.2.0Local by default
Interface preview

Working application structure

This representative capture shows the application shell and primary workspace. Actual results depend on the information entered and the workflow completed.
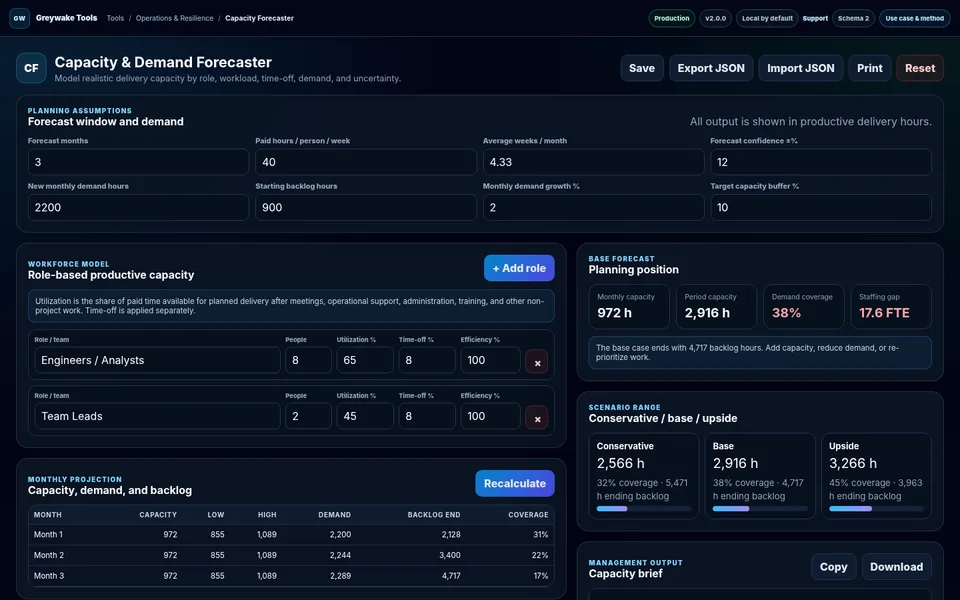
Capacity Forecaster application interface
Representative application interface
Desktop viewport · representative interface state
Open live application →
Visible methodAssumptions and record logic remain reviewable.
Local-first postureData handling is stated in the application.
Portable outputExports support review and continuity.
Explicit boundariesLimitations are part of the product evidence.
User and problem

Where the tool fits

Designed for: Operations leaders, service managers, workforce planners, and delivery teams balancing demand, backlog, and staffing.

Problem addressed: Headcount alone does not reveal productive capacity because utilization, time off, efficiency, demand growth, backlog, and service buffers materially change the result.

Core workflow

From input to decision-ready output

FrameStructureAnalyzeExport
1

Set the forecast horizon, working-time assumptions, demand, backlog, growth, confidence range, and target buffer

Set the forecast horizon, working-time assumptions, demand, backlog, growth, confidence range, and target buffer.

2

Add roles with headcount, utilization, time-off, and productivity assumptions

Add roles with headcount, utilization, time-off, and productivity assumptions.

3

Compare forecast demand with productive capacity, review the gap range, and test staffing scenarios

Compare forecast demand with productive capacity, review the gap range, and test staffing scenarios.

Method

Transparent calculation and record logic

The methodology is intentionally visible so users can challenge the assumptions and validate the result against authoritative evidence.

How the application works

  • Converts headcount into productive hours using available time, utilization, time-off, and productivity factors.
  • Projects demand and backlog over the configured horizon.
  • Applies a confidence range and target buffer to expose best-case, base, and constrained capacity positions.
Illustrative output
Base productive capacity: 5,480 hours
Forecast demand + backlog: 6,230 hours
Base gap: -750 hours
Planning range: -1,410 to -90 hours
Boundaries

What the result does not prove

  • The model assumes entered rates remain representative during the forecast.
  • It does not schedule individual work or account for every skill dependency and queue effect.
  • Utilization above sustainable levels can create delay and quality risk even when arithmetic capacity appears adequate.
Working data remains local to this browser unless the application explicitly describes an external request or the user exports a file. Browser storage can be lost when data is cleared or the device changes.
Organizational fit

Use the method as-is or adapt it to your operating model.

Greywake can tailor fields, terminology, controls, calculations, exports, and deployment requirements. The inquiry link identifies this guide but does not transmit application data.

Discuss a tailored version →